Let's start out with some basic information about the organization where these metrics were gathered. It's a non-profit based in Palm Beach County, Florida called Community Partnership Group and it's divided into three divisions. The largest of the three has 123 positions, thirteen hiring managers, as well as, the highest turnover. The goal was not only to gather the quality-of-hire metrics but also to improve them.
About The Hiring Managers: Each of the thirteen hiring managers were surveyed to determine their skill level and experience as an interviewer. Here is what we learned:

- Their experience level at making hiring decisions ranged from one to 20+ years, with 6 years being the average.
- Nine of the 13 interviewers had never received any formal training on how to interview or hire.
- Asked how confident they felt in their ability as an interviewer. The average rating was 4.8. On a 1 - 10 scale...that's not very high.
Next...all thirteen were put through a one-day, instructor-led motivation-based interviewing (MBI) workshop. This is interviewer training specifically designed for hiring High Performers. Two more survey questions (post-MBI training) were asked:
How confident do you feel in your ability as an interviewer going forward? Their confidence level soared from 4.8 to 8.8!
Would you recommend the MBI interviewer training? Unanimously...100% said yes!
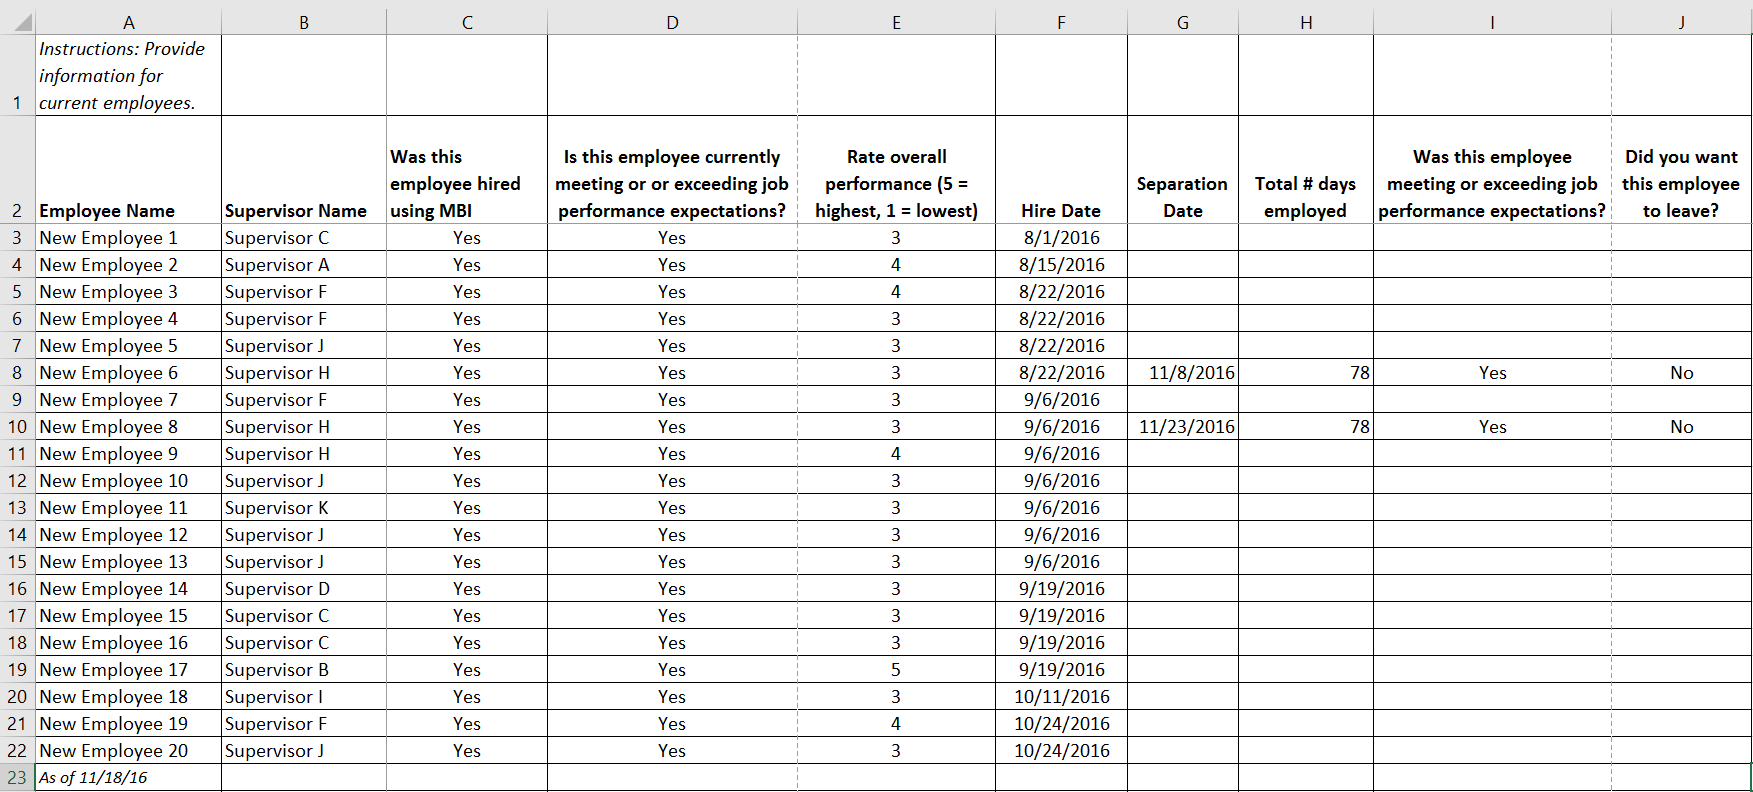
Quality-of-Turnover Metrics: Let's start reviewing the metrics. Here's an overview: There are six Excel spreadsheet tabs in total. The first three tabs pertain to the past, both hires and turnover, for the thirteen hiring managers. This baseline includes data for a period of one year prior to the MBI interviewer training. Tab one is the data itself. Tab two are the metrics, and tab three consists of two pie charts. Tabs four through six are similar, except they track the data going forward and are ongoing. Next, the data is real, however all names have been removed for confidentiality purposes.
The Past (Baseline) Data - Highlights:
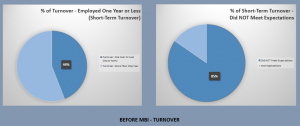
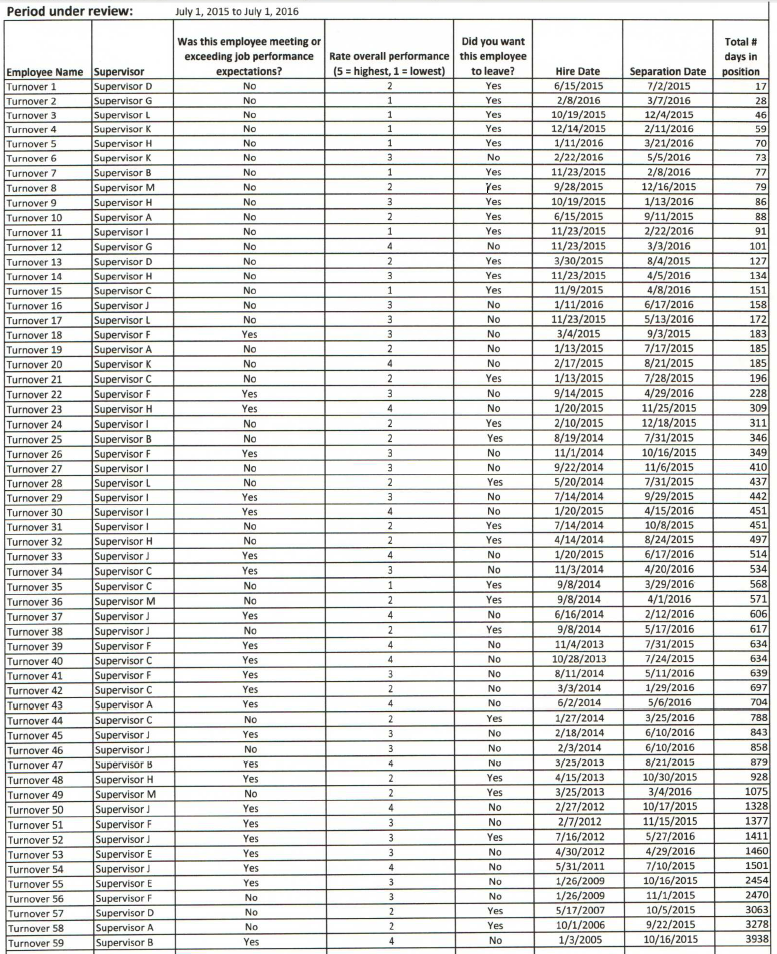
- The yes/no responses from the question "Was this employee meeting or exceeding job performance expectations?" is used to calculate quality-of-turnover.
- The 1-5 "overall performance" rating along with the yes/no responses from "Did you want this employee to leave?" are used for validation purposes only.
- The far right column titled "Total # days in position" is calculated automatically (from dates of employment) and is used to distinguish short-term turnover as 365 days or less.
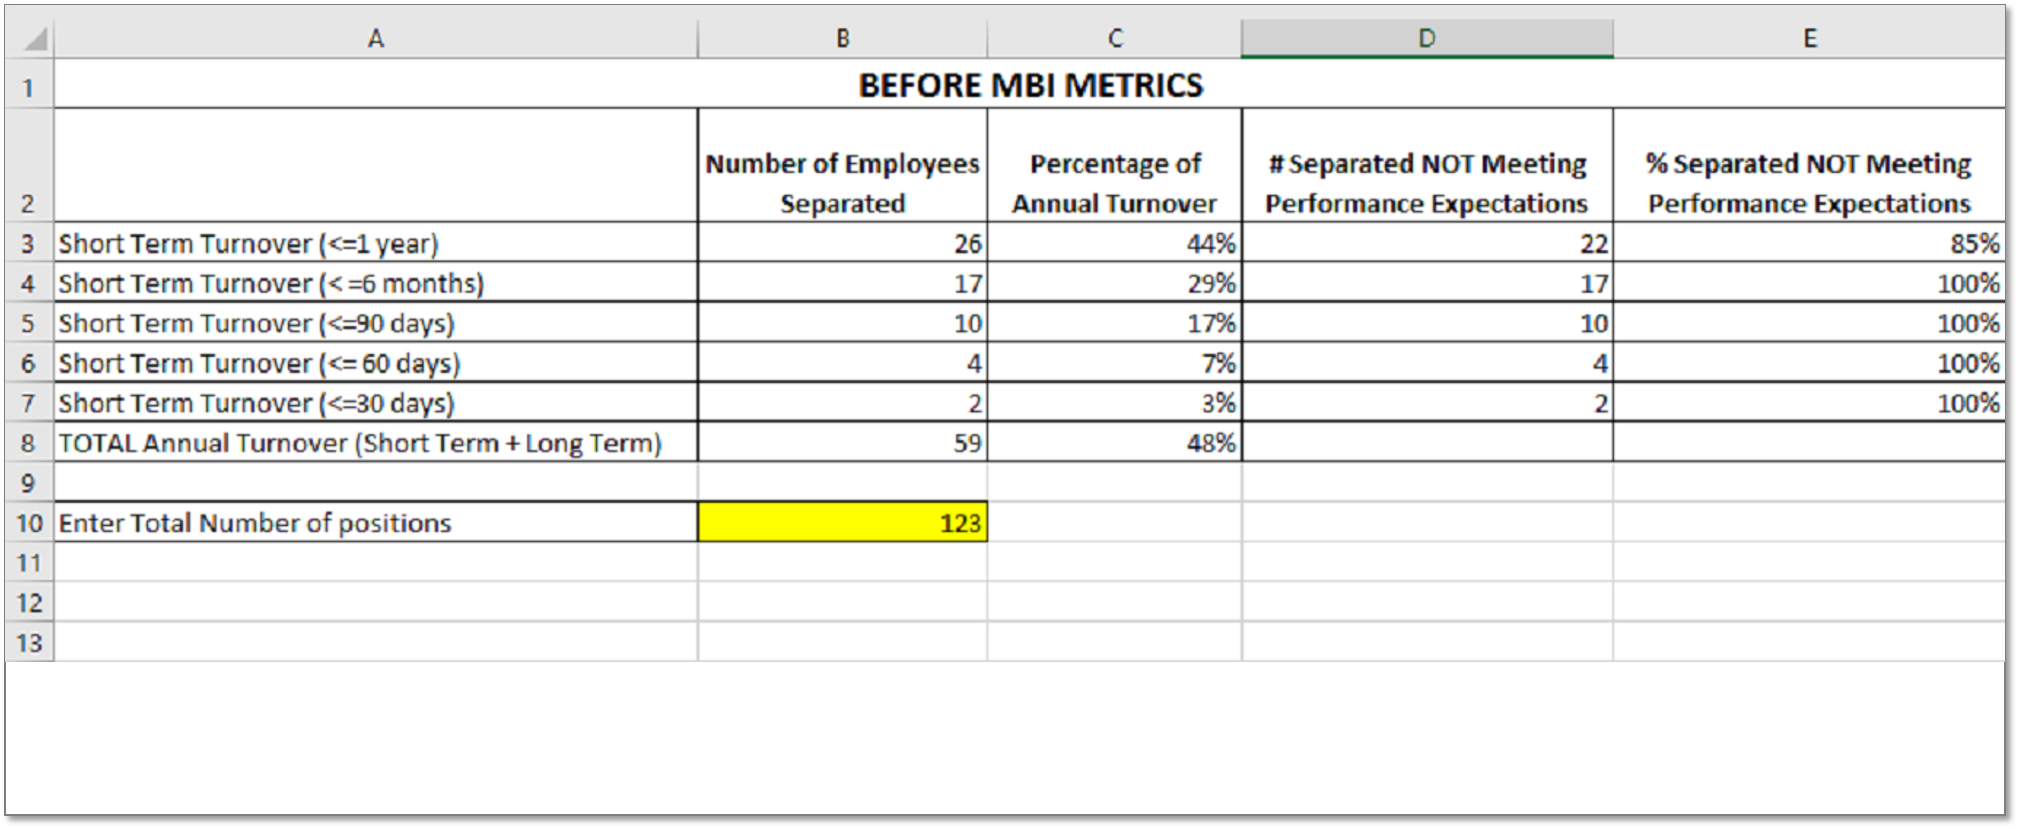
Worth noting is the 59 employees (of 123) who left during the 12 month turnover period under review .
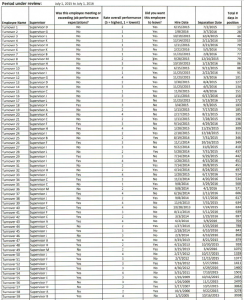
The Past (Baseline) Metrics - Highlights:
- The total number of positions is 123. This number is important because the annual turnover percentage is based on it. For example...the 59 employees who exited is divided by the 123 total positions to produce the total annual turnover percentage of 48%.
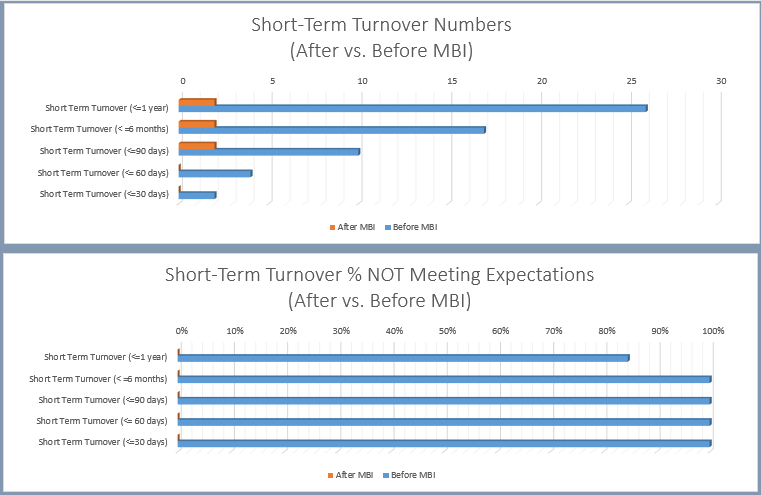
- The short-term turnover is broken into 30, 60 and 90 days, 6 months, and one year. These numbers are cumulative so the "one year or less" row contains the total for the entire year.
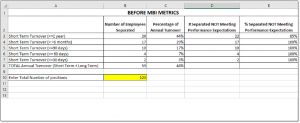
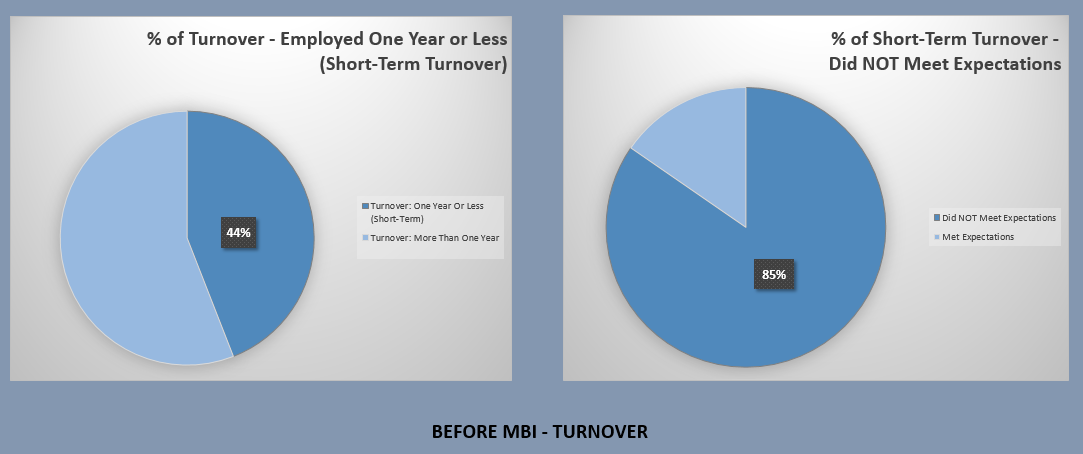
- The short-term turnover = 44%. Or, 26 new hires stayed less than one year.
Of the 44% short-term turnover, 85% failed to meet performance expectations.- This 85% is significant! This data clearly exposes a quality-of-hire problem that was hidden (or was view solely as a turnover problem) prior to these metrics.
NEW QUALITY-OF-TURNOVER METRICS (After MBI Training):
As noted above, the example organization discovered a good portion of its high turnover was being driven by poor hiring decisions. Before new hiring data could be collected, corrective action to improve quality-of-hire needed to be implemented. Surveying the 13 Hiring Managers provided insight to their need for training. The interviewers completed an instructor-led motivation-based interviewing (MBI) workshop. MBI training goes beyond skill-assessment alone and teaches interviewers how to assess the three components common to all "High Performers." The three components that enable High Performers to produce above-average results are skill, attitude and passion. The interviewers also learned how to write and ask effective interview questions and MBI interview guides were created with the assistance of HR who were also MBI trained. (Note: Behavior-based interviewing was not provided. It is believed to be ineffective, part of the problem and the reason behind many bad hires.)
The past data looked at hiring and turnover for the last 12 months. It asked supervisors to answer three basic questions making it fairly quick to gather the necessary information to calculate the baseline metrics. Going forward, the metrics track similar information so a before/after comparison can be made, but it's not so quick. It takes a year plus to collect this data, with recommended updates every two months. Training and ramp up time are also taken into consideration, meaning a new hire's job performance isn't evaluated for at least four months...unless someone leaves sooner. It's not uncommon to start seeing a change in results well before a year. Although the Community Partners Group data collections in still ongoing (updates will be posted), you will already notice a dramatic improvement both in quality-of-hiring and a reduction in turnover. Expand and take a closer look at the data and comparison graphs to the right. Click the NEXT button to download the easy do-it-yourself instructions along with the Excel template with built-in formulas.